Website performance optimization is no longer optional in 2026.
If your site fails Core Web Vitals (LCP, INP, CLS), you lose rankings, conversions, and user trust.
In this guide, I’ll show you exactly how to fix LCP, INP, and CLS using proven website performance optimization strategies across frontend, backend, CDN, caching, and AI monitoring.
If you want this done professionally, I also offer:
🚀 Website performance optimization service 🤖 AI integrations for monitoring + automation 💼 View my portfolio
Quick Navigation
- Quick Wins (15 Minutes)
- Why Performance Matters
- Core Web Vitals Explained
- Top Optimization Strategies
- AI + Monitoring
- Common Mistakes
- Freelancer Pricing Guide
- Checklist
- FAQ
Quick Wins (Do These in 15 Minutes)
If you want immediate improvements before touching code, start here:
- Convert your hero image to AVIF/WebP under 100KB (Squoosh works great)
- Add
width+heightto every<img>(prevents CLS instantly) - Add long caching for versioned assets:
Cache-Control: public, max-age=31536000, immutable
- Put your site behind Cloudflare CDN (even free plan improves TTFB globally)
- Run:
- Google PageSpeed Insights (lab + CrUX field data)
- WebPageTest (waterfall + LCP breakdown)
- Save the baseline before changing anything
Why Website Performance Matters
The Business Case for Speed
Performance is no longer a “developer-only” concern. It directly impacts SEO, conversions, and trust.
- Lower bounce rates: users abandon slow pages fast (especially on mobile).
- Better SEO visibility: Core Web Vitals are part of Google’s Page Experience signals.
- Higher conversions: faster sites reduce friction and increase completed actions.
- More trust: a fast site signals professionalism before users even read your content.
Real-world examples:
- Walmart publicly reported conversion improvements tied to faster load times.
- Pinterest improved perceived speed and saw measurable sign-up and traffic gains.
- Google + Deloitte published research linking speed improvements to conversion lifts.
Real Client Example (Laravel SaaS Project)
Recently, I optimized a Laravel + Vue SaaS dashboard for a US client.
Before optimization:
- LCP: 4.1s
- INP: 320ms
- CLS: 0.18
After optimization:
- LCP: 1.9s
- INP: 120ms
- CLS: 0.03
What I fixed:
- Converted hero image to AVIF
- Implemented Redis caching for heavy queries
- Removed 3 blocking third-party scripts
- Deployed Cloudflare edge caching
Result:
+22% increase in demo bookings within 30 days.
The Mobile Performance Imperative
With over 60% of global web traffic now coming from mobile devices, mobile site performance deserves special emphasis. Mobile users often contend with slower network connections and less powerful hardware, making optimization even more critical. Google's shift to mobile-first indexing means your mobile experience is now the primary version Google evaluates for ranking purposes.
👉 Mobile performance optimization service
Key Metrics to Track: Understanding Core Web Vitals and Beyond
Before you can optimize, you need to measure. The performance metrics ecosystem has matured significantly, with Google's Core Web Vitals framework providing the clearest signal of what matters most for user experience.
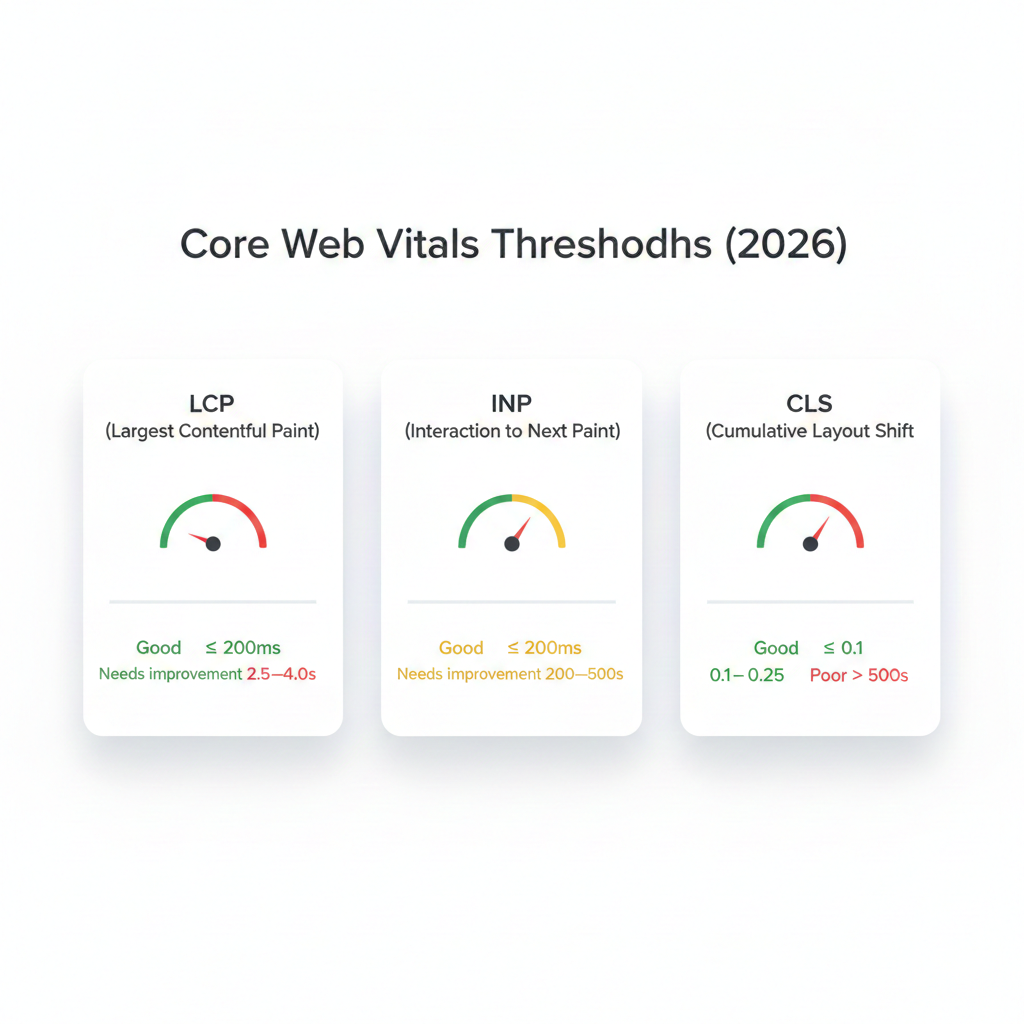
Core Web Vitals: The Essential Three
Largest Contentful Paint (LCP) LCP measures how long it takes for the largest visible element on the page usually a hero image or headline to fully render. A good LCP score is 2.5 seconds or less. Poor LCP is often caused by slow server response times, render-blocking resources, slow resource load times, and client-side rendering delays.
Interaction to Next Paint (INP) Introduced in 2024 as a replacement for First Input Delay, INP measures the overall responsiveness of a page to user interactions. A good INP score is 200 milliseconds or less. High INP is typically caused by heavy JavaScript execution that blocks the main thread.
Cumulative Layout Shift (CLS) CLS quantifies unexpected layout shifts during page load those jarring moments when content jumps around as new elements appear. A good CLS score is 0.1 or less. Common culprits include images without defined dimensions, dynamically injected content, and web fonts loading late.
Additional Performance Metrics Worth Monitoring
Beyond Core Web Vitals, a comprehensive web performance best practices approach tracks these supplementary metrics:
- Time to First Byte (TTFB): How quickly your server begins sending a response. Target under 800ms.
- First Contentful Paint (FCP): When the first piece of content renders. Target under 1.8 seconds.
- Total Blocking Time (TBT): The total amount of time the main thread is blocked. Strongly correlates with INP.
- Speed Index: How quickly content is visually populated during load.
- Page Weight / Total Transfer Size: The total size of all assets downloaded.
Essential Website Speed Tools
To measure these metrics accurately, use a combination of lab and field data tools:
- Google PageSpeed Insights — Combines lab data from Lighthouse with real-world field data from the Chrome User Experience Report (CrUX). Free, authoritative, and essential.
- web.dev Measure — Google's developer-focused tool for deeper performance analysis and learning resources.
- WebPageTest — Advanced testing with customizable connection speeds, locations, and detailed waterfall charts.
- Chrome DevTools Performance Panel — For granular, session-level profiling of rendering and JavaScript execution.
- Lighthouse CI — Automated performance testing integrated into your CI/CD pipeline to catch regressions before they reach production.
- GTmetrix — Blends Lighthouse and WebPageTest data with visual timelines and historical tracking.
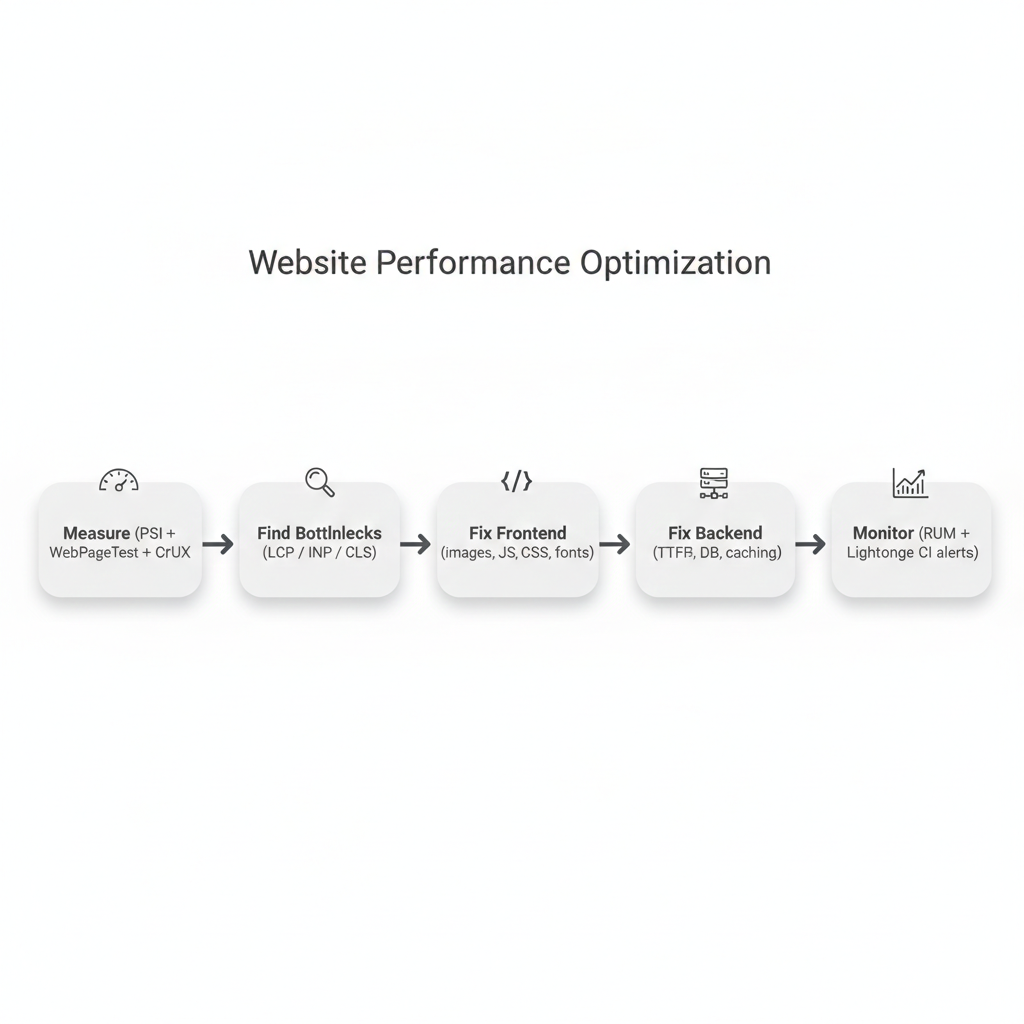
Top Strategies for Website Performance Optimization
Now for the actionable core of this guide. These techniques span front-end, back-end, and infrastructure concerns collectively they represent the most impactful levers you can pull to reduce page load time and improve user experience.
1. Image Compression and Optimization
Images typically account for 50–75% of a page's total byte weight. Optimizing them yields some of the highest ROI of any performance technique.
- Convert to modern formats: WebP offers roughly 30% better compression than JPEG at equivalent quality; AVIF offers even more but has slightly lower browser support. Use
<picture>elements with appropriate fallbacks. - Implement responsive images: Use the
srcsetandsizesattributes so browsers download appropriately sized images for each viewport rather than downloading a large desktop image on mobile. - Compress aggressively: Tools like Squoosh, ImageOptim, and Sharp (for Node.js pipelines) can reduce file sizes by 50–80% with minimal perceptible quality loss.
- Set explicit dimensions: Always specify
widthandheightattributes on<img>elements to prevent layout shifts (CLS).
2. Minify and Bundle CSS, JavaScript, and HTML
Every unnecessary byte increases transfer time and parse time. Minification removes whitespace, comments, and redundant code from source files without changing their functionality.
- Minify CSS and JS: Tools like Terser (JS), cssnano (CSS), and HTMLMinifier handle this automatically, often as part of build pipelines using Webpack, Vite, or Rollup.
- Eliminate unused code: Tree-shaking removes unused JavaScript exports. Tools like PurgeCSS identify and remove unused CSS selectors particularly powerful when using utility-first frameworks like Tailwind CSS.
- Code splitting: Instead of loading one massive JavaScript bundle, split code so users only download what they need for the current page. Next.js and modern bundlers handle this automatically.
- Defer non-critical JavaScript: Use
deferandasyncattributes on script tags to prevent render-blocking. Move non-critical scripts to load after the page is interactive.
3. Implement Effective Caching Strategies
Caching ensures that repeat visitors and even first-time visitors after the first load receive assets from local or edge caches rather than fetching them from your origin server.
- Browser caching: Set appropriate
Cache-ControlandExpiresheaders. Static assets like fonts, images, and versioned CSS/JS files can safely be cached for a year or more. - Service workers: For progressive web apps and advanced caching scenarios, service workers enable fine-grained control over what gets cached and how cache misses are handled.
- Server-side caching: Cache rendered HTML pages, database query results, and API responses using tools like Redis, Memcached, or built-in CMS caching layers (e.g., WP Super Cache for WordPress, Varnish for custom stacks).
- Object caching: In database-heavy applications, cache the results of expensive queries so they don't hit the database on every request.
4. Deploy a Content Delivery Network (CDN)
A CDN distributes your static assets and increasingly, entire pages across a global network of edge servers. When a user requests your site, they receive content from the nearest edge node rather than your central origin server, dramatically reducing latency.
Leading CDN providers include Cloudflare, Fastly, AWS CloudFront, and Bunny.net. Modern CDNs offer additional performance features including HTTP/3 support, automatic image optimization, edge-side rendering, and DDoS protection.
For globally distributed audiences, a CDN can reduce TTFB by hundreds of milliseconds the difference between a good and poor user experience for international visitors.
5. Lazy Loading and Prioritization
Not all content needs to load immediately. Lazy loading defers the loading of off-screen resources until they're needed.
- Native image lazy loading: The
loading="lazy"attribute on<img>and<iframe>elements is now natively supported in all modern browsers and requires zero JavaScript. - Lazy load iframes: Embedded videos, maps, and third-party widgets are often heavy. Lazy loading them or replacing them with click-to-load facades can dramatically reduce initial page weight.
- Priority hints: Use
fetchpriority="high"on your LCP image to signal to the browser that it should be fetched with elevated priority. - Preloading critical assets: Use
<link rel="preload">for fonts, hero images, and critical CSS to start fetching them earlier in the load cycle.
6. Optimize Web Fonts
Web fonts are a notorious source of performance pain, contributing to both FCP delays and CLS (when text reflows as fonts load).
- Use
font-display: swap: This ensures text is displayed immediately using a fallback font while the custom font loads, preventing invisible text. - Subset fonts: Only include the character sets you actually use. Google Fonts allows subsetting via URL parameters.
- Self-host fonts: Eliminates a third-party DNS lookup and connection, and gives you full control over caching headers.
- Limit font variants: Every additional weight and style is an additional file to download. Audit your design system and eliminate unnecessary variants.
7. Optimize Server Response and Infrastructure
Front-end optimization only goes so far if your server is slow to respond. Back-end performance is foundational.
- Upgrade hosting: Shared hosting is rarely adequate for performance-sensitive applications. Consider managed cloud hosting (AWS, GCP, Azure, DigitalOcean) with appropriately sized instances.
- Use HTTP/2 or HTTP/3: HTTP/2 enables multiplexing (multiple requests over a single connection), header compression, and server push. HTTP/3 further reduces latency on unreliable connections.
- Database optimization: Index frequently queried columns, optimize slow queries, and implement connection pooling. Regular database audits can surface significant performance bottlenecks.
- Reduce server-side processing: Move computationally expensive work to background jobs or worker queues so user-facing requests return quickly.
👉 Full-stack web development (Laravel / Next.js)
Stack-Specific Notes (Laravel / Next.js / WordPress)
If you're using Next.js
- Prefer SSR/SSG for landing pages where possible.
- Avoid heavy client-side hydration for simple pages.
- Use
next/imageproperly with responsive sizes.
If you're using Laravel
- Enable route + config caching in production.
- Use Redis for caching heavy queries.
- Avoid rendering huge Blade loops without pagination.
If you're using WordPress
- Remove bloated page builders when possible.
- Use a lightweight theme and disable unused plugins.
- Implement full-page caching + CDN.
AI Integration in Web Optimization: The Next Frontier
Artificial intelligence is transforming how developers approach website performance optimization, moving from reactive manual audits to proactive, automated, and increasingly self-healing systems. My AI integration services
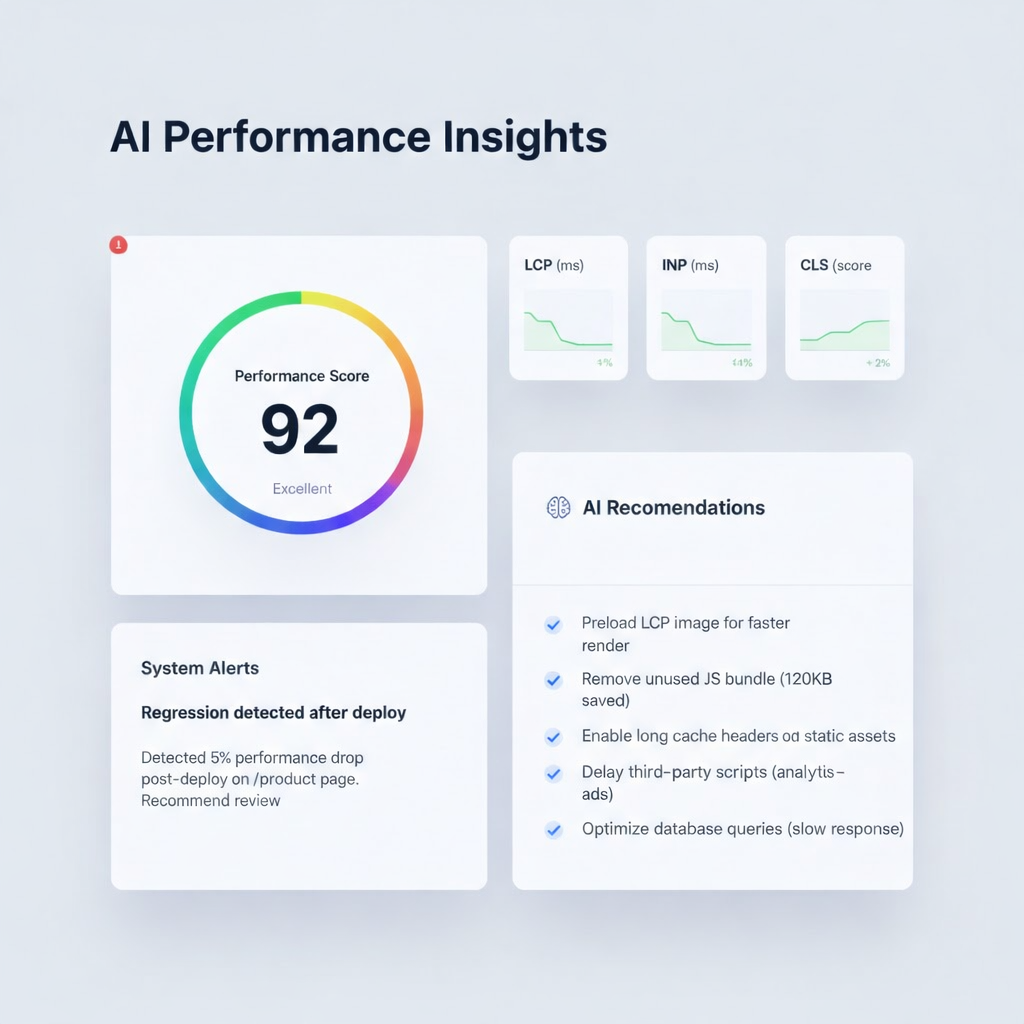
AI-Powered Performance Auditing
Traditional performance audits require manual analysis of PageSpeed Insights reports, waterfall charts, and server logs a time-consuming process that captures only a snapshot in time. AI-driven web optimization platforms continuously monitor performance signals and automatically surface actionable recommendations, prioritized by expected impact.
Tools like SpeedCurve, Calibre, and emerging AI-powered platforms use machine learning to detect performance regressions, identify patterns across large datasets of real user monitoring (RUM) data, and correlate performance metrics with business outcomes like conversion rates.
Predictive Performance Management
Beyond reactive auditing, AI enables predictive performance management. By analyzing historical traffic patterns, deployment histories, and infrastructure metrics, machine learning models can predict performance degradation before it affects users allowing teams to intervene proactively.
For example, an AI system might detect that after every major JavaScript bundle update, LCP scores degrade by an average of 200ms and automatically trigger a rollback or alert the engineering team before real users are affected at scale.
AI-Driven Image Optimization
AI-powered image optimization goes beyond simple compression. Neural network-based models like those powering Cloudinary's AI features or Imgix can:
- Intelligently crop images to focus on the most important subject matter at different aspect ratios
- Dynamically adjust quality based on network conditions and device capabilities
- Convert formats automatically based on browser support
- Generate appropriately sized variants for every breakpoint automatically
Automated Code Optimization
AI code assistants are increasingly capable of identifying performance anti-patterns in codebases. Tools like GitHub Copilot, Cursor, and purpose-built performance linting tools can flag expensive React re-renders, inefficient database queries, blocking API calls, and other issues during the development phase before they reach production.
Some platforms are beginning to offer autonomous optimization agents that can identify, test, and deploy performance improvements with minimal human intervention a capability that will fundamentally change how performance optimization is practiced at scale.
Real User Monitoring with AI Analysis
Real User Monitoring (RUM) tools collect performance data from actual users in the field. When combined with AI analysis, RUM data can reveal segment-specific performance issues for instance, that users on a specific carrier in a particular region experience dramatically higher LCP scores that would be invisible in lab-only testing.
My AI integration services leverage these capabilities to build custom performance monitoring pipelines, implement automated optimization workflows, and help businesses move from one-time audits to continuous, data-driven performance management.
Common Website Performance Mistakes to Avoid
Even experienced developers fall into these performance traps. Avoid these common pitfalls to protect your scores and user experience.
1. Ignoring Real User Data Lab tools like Lighthouse run on a controlled device and network they don't reflect the diversity of your actual user base. Always supplement lab data with field data from CrUX or your own RUM implementation.
2. Render-Blocking Resources
Loading CSS and JavaScript in the <head> without defer or async attributes forces the browser to stop rendering until those files are downloaded and parsed. Audit your critical rendering path and eliminate unnecessary blocking resources.
3. Loading Everything on Page Load Not every feature needs to be loaded immediately. Third-party scripts (chat widgets, analytics, advertising tags) are particularly notorious for degrading performance. Audit every third-party script and defer or remove those that aren't critical to the initial user experience.
4. Neglecting TTFB Many developers focus exclusively on front-end optimizations while ignoring server response times. A slow TTFB sets a bad foundation even a perfectly optimized front-end can't fully compensate for a server that takes 2 seconds to respond.
5. Not Setting Image Dimensions
Failing to specify width and height on images is one of the most common causes of poor CLS scores. Always define dimensions so the browser can reserve space before the image loads.
6. Over-Relying on a Single Performance Tool Different tools measure different things. PageSpeed Insights shows both lab and field data; WebPageTest provides detailed waterfall analysis; Chrome DevTools enables session-level profiling. Use multiple tools to get a complete picture.
7. Treating Performance as a One-Time Project Performance degrades over time as new features, third-party integrations, and content are added. Continuous monitoring and a culture of performance awareness not periodic audits is what sustains fast sites.
8. Ignoring the Critical Rendering Path Understanding which resources are required to display above-the-fold content and optimizing specifically for those is fundamental to improving perceived load times and LCP scores.
How Indian Freelancers Can Sell Performance Optimization (And Charge More)
If you’re a freelance developer in India pitching clients in the US/UK, performance is one of the easiest ways to justify higher pricing because the results are measurable.
What clients usually complain about:
- “The site is slow on mobile”
- “SEO traffic dropped”
- “The landing page doesn’t convert”
- “Our PageSpeed score is bad”
How you can package this as a service:
- Performance Audit (1–2 days): Lighthouse + CWV + action plan
- Quick Fix Sprint (3–5 days): Images, caching, scripts, CLS fixes
- Full Optimization (2–3 weeks): Front-end + backend + infra
- Monthly Monitoring Retainer: Lighthouse CI + RUM + regression alerts
If you want this done for your site, I offer the same as a service: 👉 Contact me
A Practical Performance Optimization Checklist
Use this checklist to audit your site against web performance best practices:
Images and Media
- [ ] Images served in WebP or AVIF format
- [ ] Images are responsive with
srcsetandsizes - [ ] All images have explicit
widthandheightattributes - [ ] Off-screen images use
loading="lazy" - [ ] LCP image uses
fetchpriority="high"
CSS and JavaScript
- [ ] CSS and JS are minified
- [ ] Unused CSS removed (PurgeCSS or similar)
- [ ] JavaScript is code-split and deferred
- [ ] No render-blocking scripts in
<head>
Caching and Delivery
- [ ] Static assets have long-lived
Cache-Controlheaders - [ ] CDN deployed for static assets
- [ ] HTTP/2 or HTTP/3 enabled
- [ ] Server-side or edge caching implemented
Fonts
- [ ] Fonts use
font-display: swap - [ ] Fonts are self-hosted or subsetted
- [ ] Number of font weights/styles minimized
Monitoring
- [ ] Core Web Vitals monitored continuously
- [ ] Real User Monitoring implemented
- [ ] Performance budget defined and enforced in CI/CD
FAQ: Website Performance Optimization
What is a good Core Web Vitals score in 2026?
Aim for LCP ≤ 2.5s, INP ≤ 200ms, and CLS ≤ 0.1 on your most important pages.
Is PageSpeed Insights enough?
No. Use PageSpeed Insights for quick audits, but combine it with WebPageTest and real user data (CrUX or RUM).
What gives the biggest speed improvement quickly?
Usually:
- Compressing the hero image
- Removing heavy third-party scripts
- Deploying CDN + caching headers
- Reducing JavaScript bundle size
Conclusion: Turn Performance Into a Competitive Advantage
Website performance optimization is one of the highest-ROI investments a business can make in its digital presence. Faster load times improve SEO rankings, increase user retention, reduce bounce rates, and directly boost conversion rates. The strategies outlined in this guide from image compression and CDN deployment to AI-powered performance auditing represent the current state of the art in web performance best practices.
But knowledge is only the first step. Implementing these optimizations correctly, sustaining them over time, and leveraging cutting-edge AI integration to automate and predict performance issues requires both technical depth and a systematic approach.
As a full-stack developer working on performance-heavy SaaS and client projects, I combine deep technical optimization with AI-powered monitoring systems to deliver measurable improvements in LCP, INP, and CLS. Whether you need a one-time performance audit, a full-scale site rebuild optimized from the ground up, or an intelligent, continuously monitored performance management system, I have the skills and experience to deliver measurable results.
Ready to Improve Your Core Web Vitals?
If you want real improvements (not just theory), I can help you:
- Run a full Core Web Vitals audit (LCP, INP, CLS)
- Implement fixes in Laravel / Next.js / WordPress
- Deploy caching + CDN correctly
- Set up monitoring so your performance stays fast after every update
⚡ Contact me for a performance audit
🔍 Explore AI integrations for monitoring
📂 View my portfolio
A slow site silently drains traffic and revenue. Let’s fix it.
Further Reading and Resources
- Google PageSpeed Insights — Test your site and get actionable recommendations
- web.dev Performance Guide — Google's comprehensive resource for web performance best practices
- Core Web Vitals Documentation — Deep dives into each Core Web Vitals metric